Resources
A library of no-code solutions, guides, and learning resources for data storytelling.
Guides
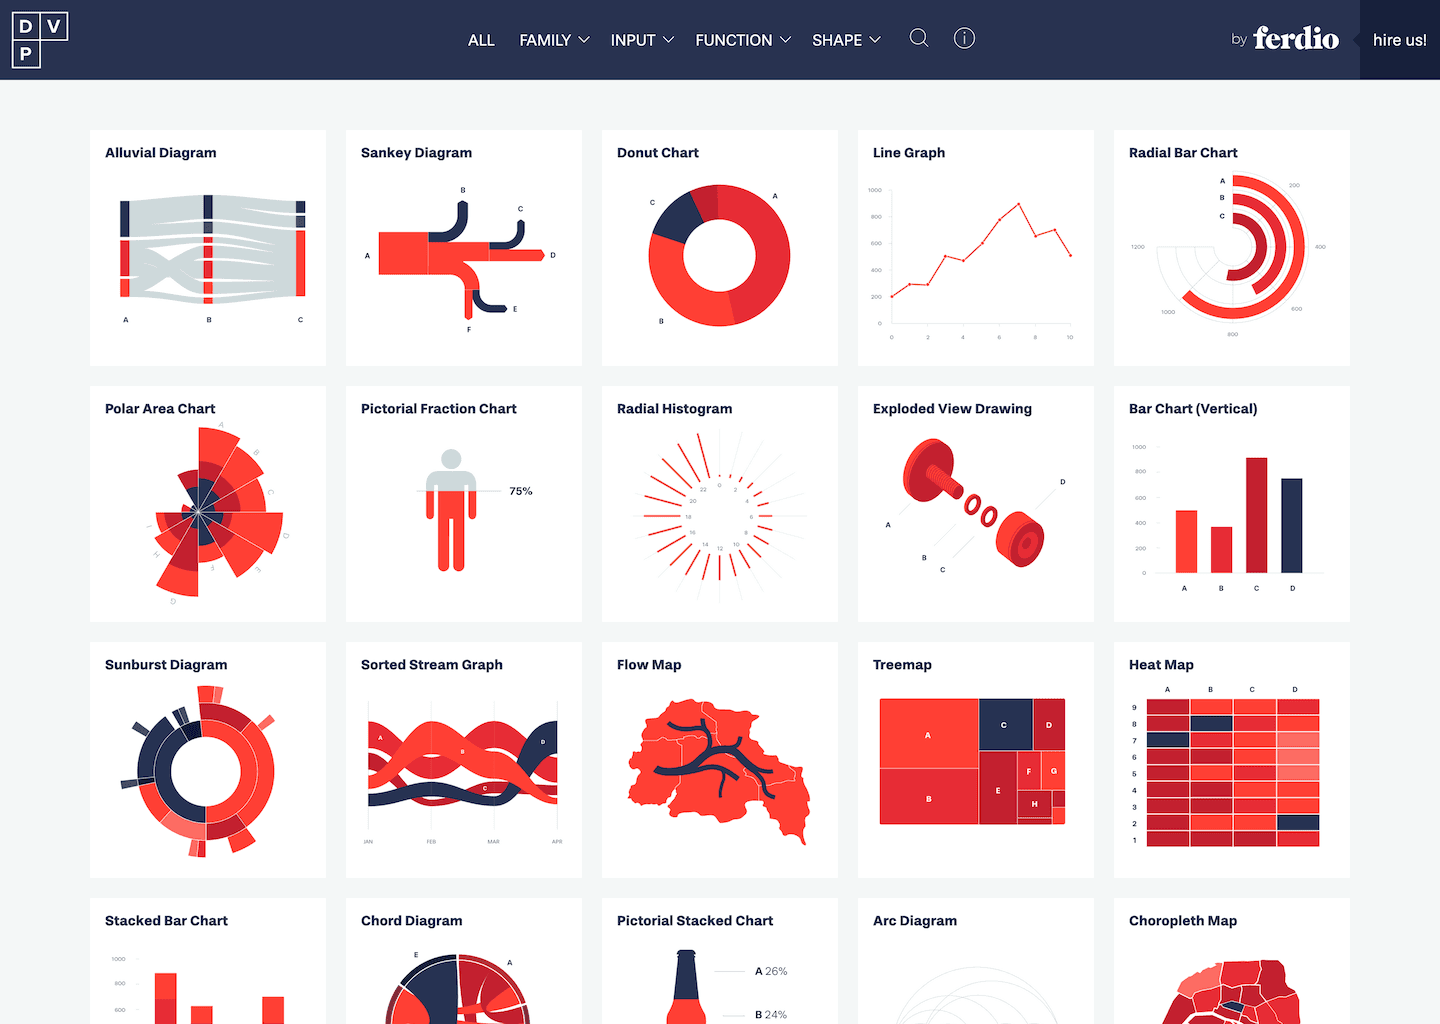
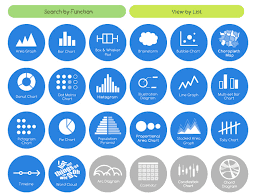
Data Viz Project
Collection of data visualizations to get inspired and find the right type
Ferdio
Guides
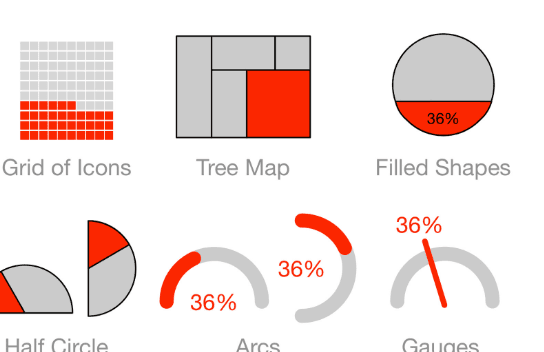
Visualizing Percentages
Reference sheet for different ways to visualize percentage data.
Info Newt
Guides
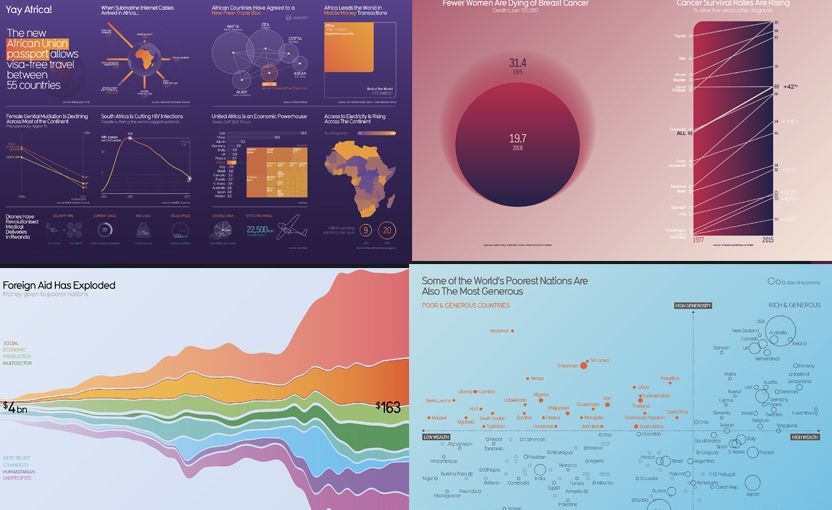
Information is Beautiful
The Information is Beautiful Awards has been celebrating excellence & beauty in ...
Information is Beautiful
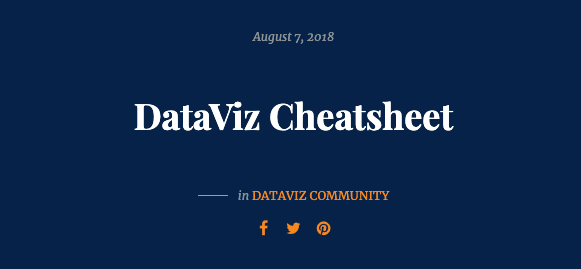
DataViz Cheatsheet - PolicyViz
Download a copy of my Core Principles of Data Visualization Cheat Sheet, a summa...
PolicyViz
Guides
The Data Visualisation Catalogue
A handy guide and library of different data visualization techniques, tools, and...
The Data Visualisation Catalogue

Guides
Learning
Reading List
The books I love.
Buried Signals
Guides
Twitter List
Twitter list of visual journalists and storytellers.
Buried Signals

Code
ScrollyVideoJS
Responsive scrollable videos without obscure video encoding requirements. Compat...
ScrollyVideo
Guides
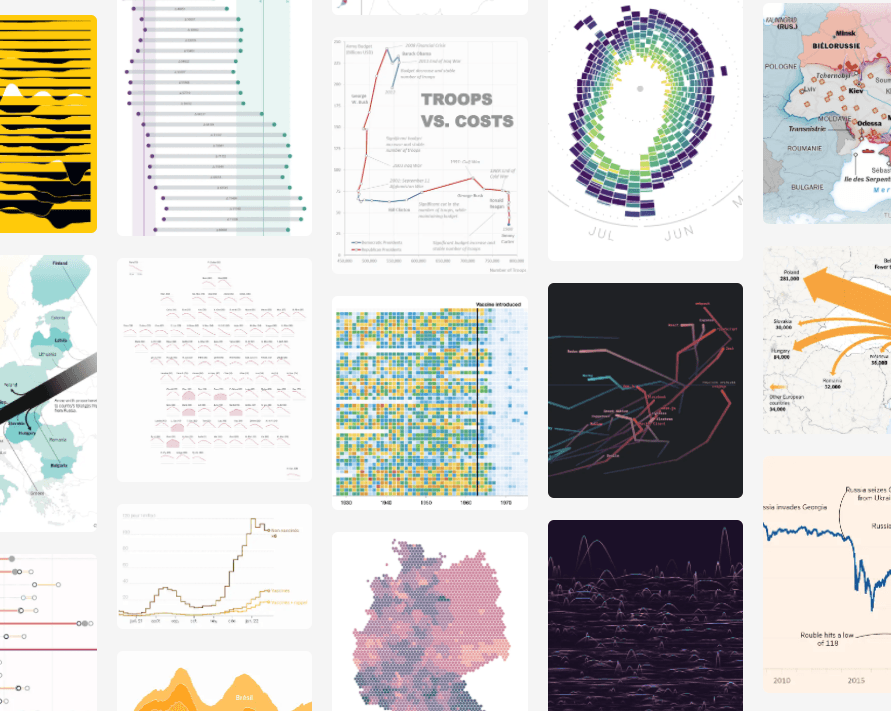
Dataviz Inspiration | Hundreds of chart ...
The biggest list of chart examples available on the web. 149 of the best viz pro...
Dataviz Inspiration
Guides
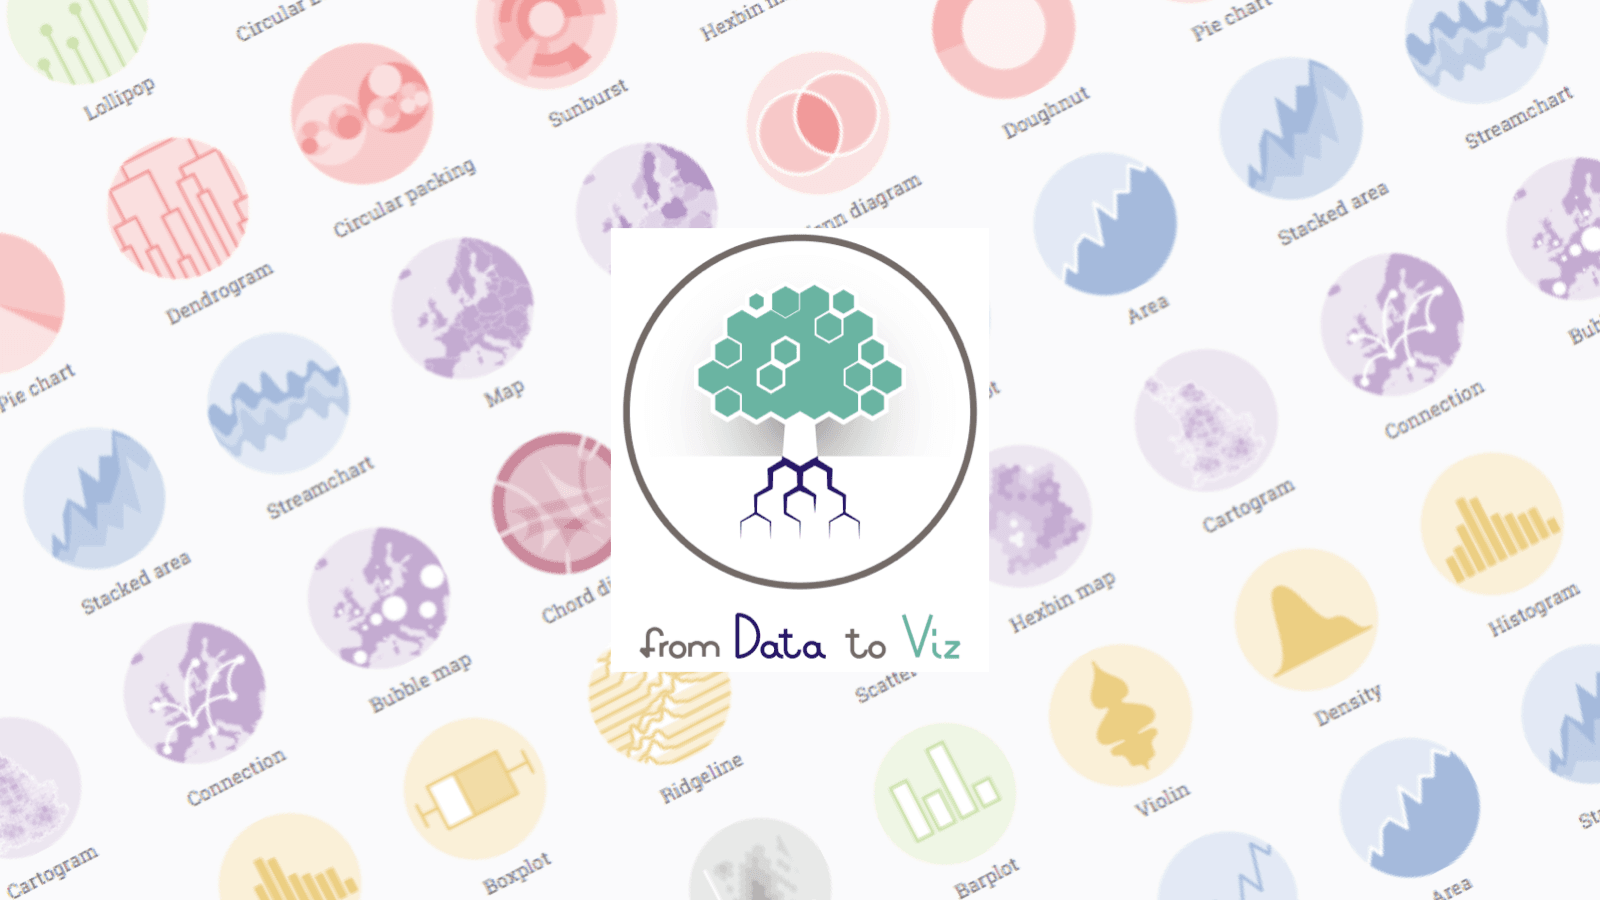
From Data to Viz
A classification of all possible chart types classified following the input data...
Data to Viz
No-code
Framer
Easily go from design to world-class site with Framer, the web builder for creat...
Framer
No-code
MediaStorm Platform
The freedom to create, the freedom to be seen, and the freedom to thrive. We kno...
MediaStorm Platform
No-code
Inkle
A narrative scripting language for games.
Inkle
No-code
Felt
Felt lets you create maps collaboratively, using world-class data, and share the...
Felt
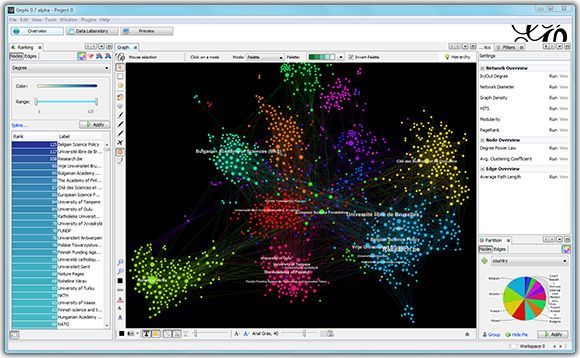
Code
Gephi
Gephi is the leading visualization and exploration software for all kinds of gra...
Gephi
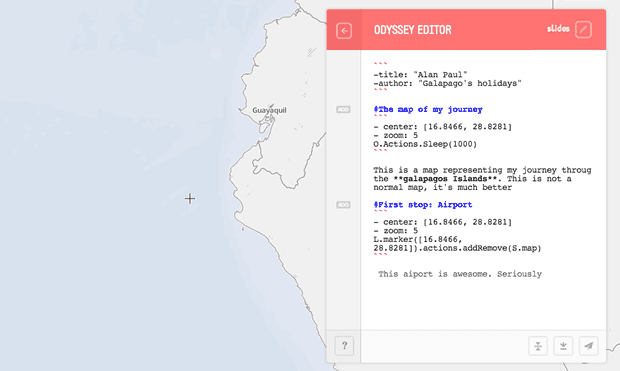
No-code
OdysseyJS
A simple way for journalists, designers, and creators to weave interactive stori...
CartoDB
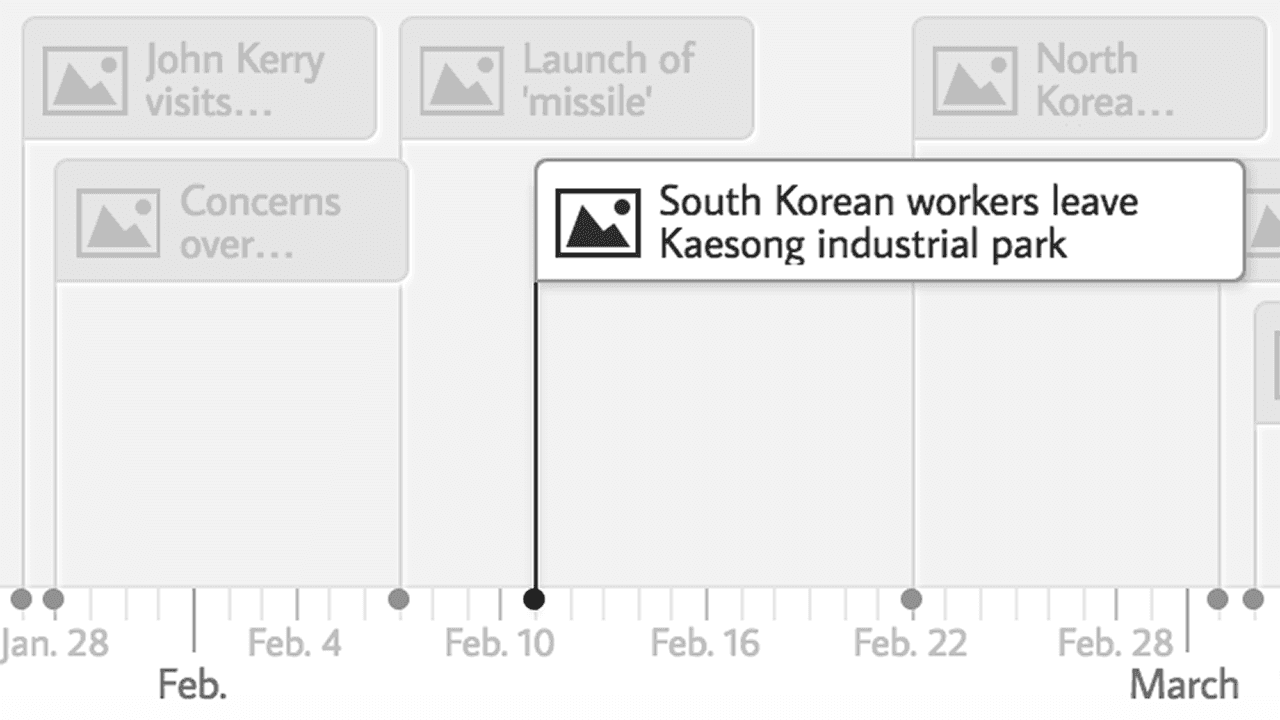
No-code
TimelineJS
TimelineJS is an open-source tool that enables anyone to build visually rich, in...
Timeline
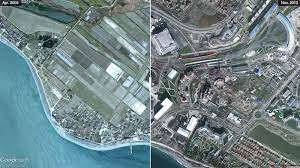
No-code
JuxtaposeJS
Juxtapose helps you tell a story comparing two images.
Juxtapose
No-code
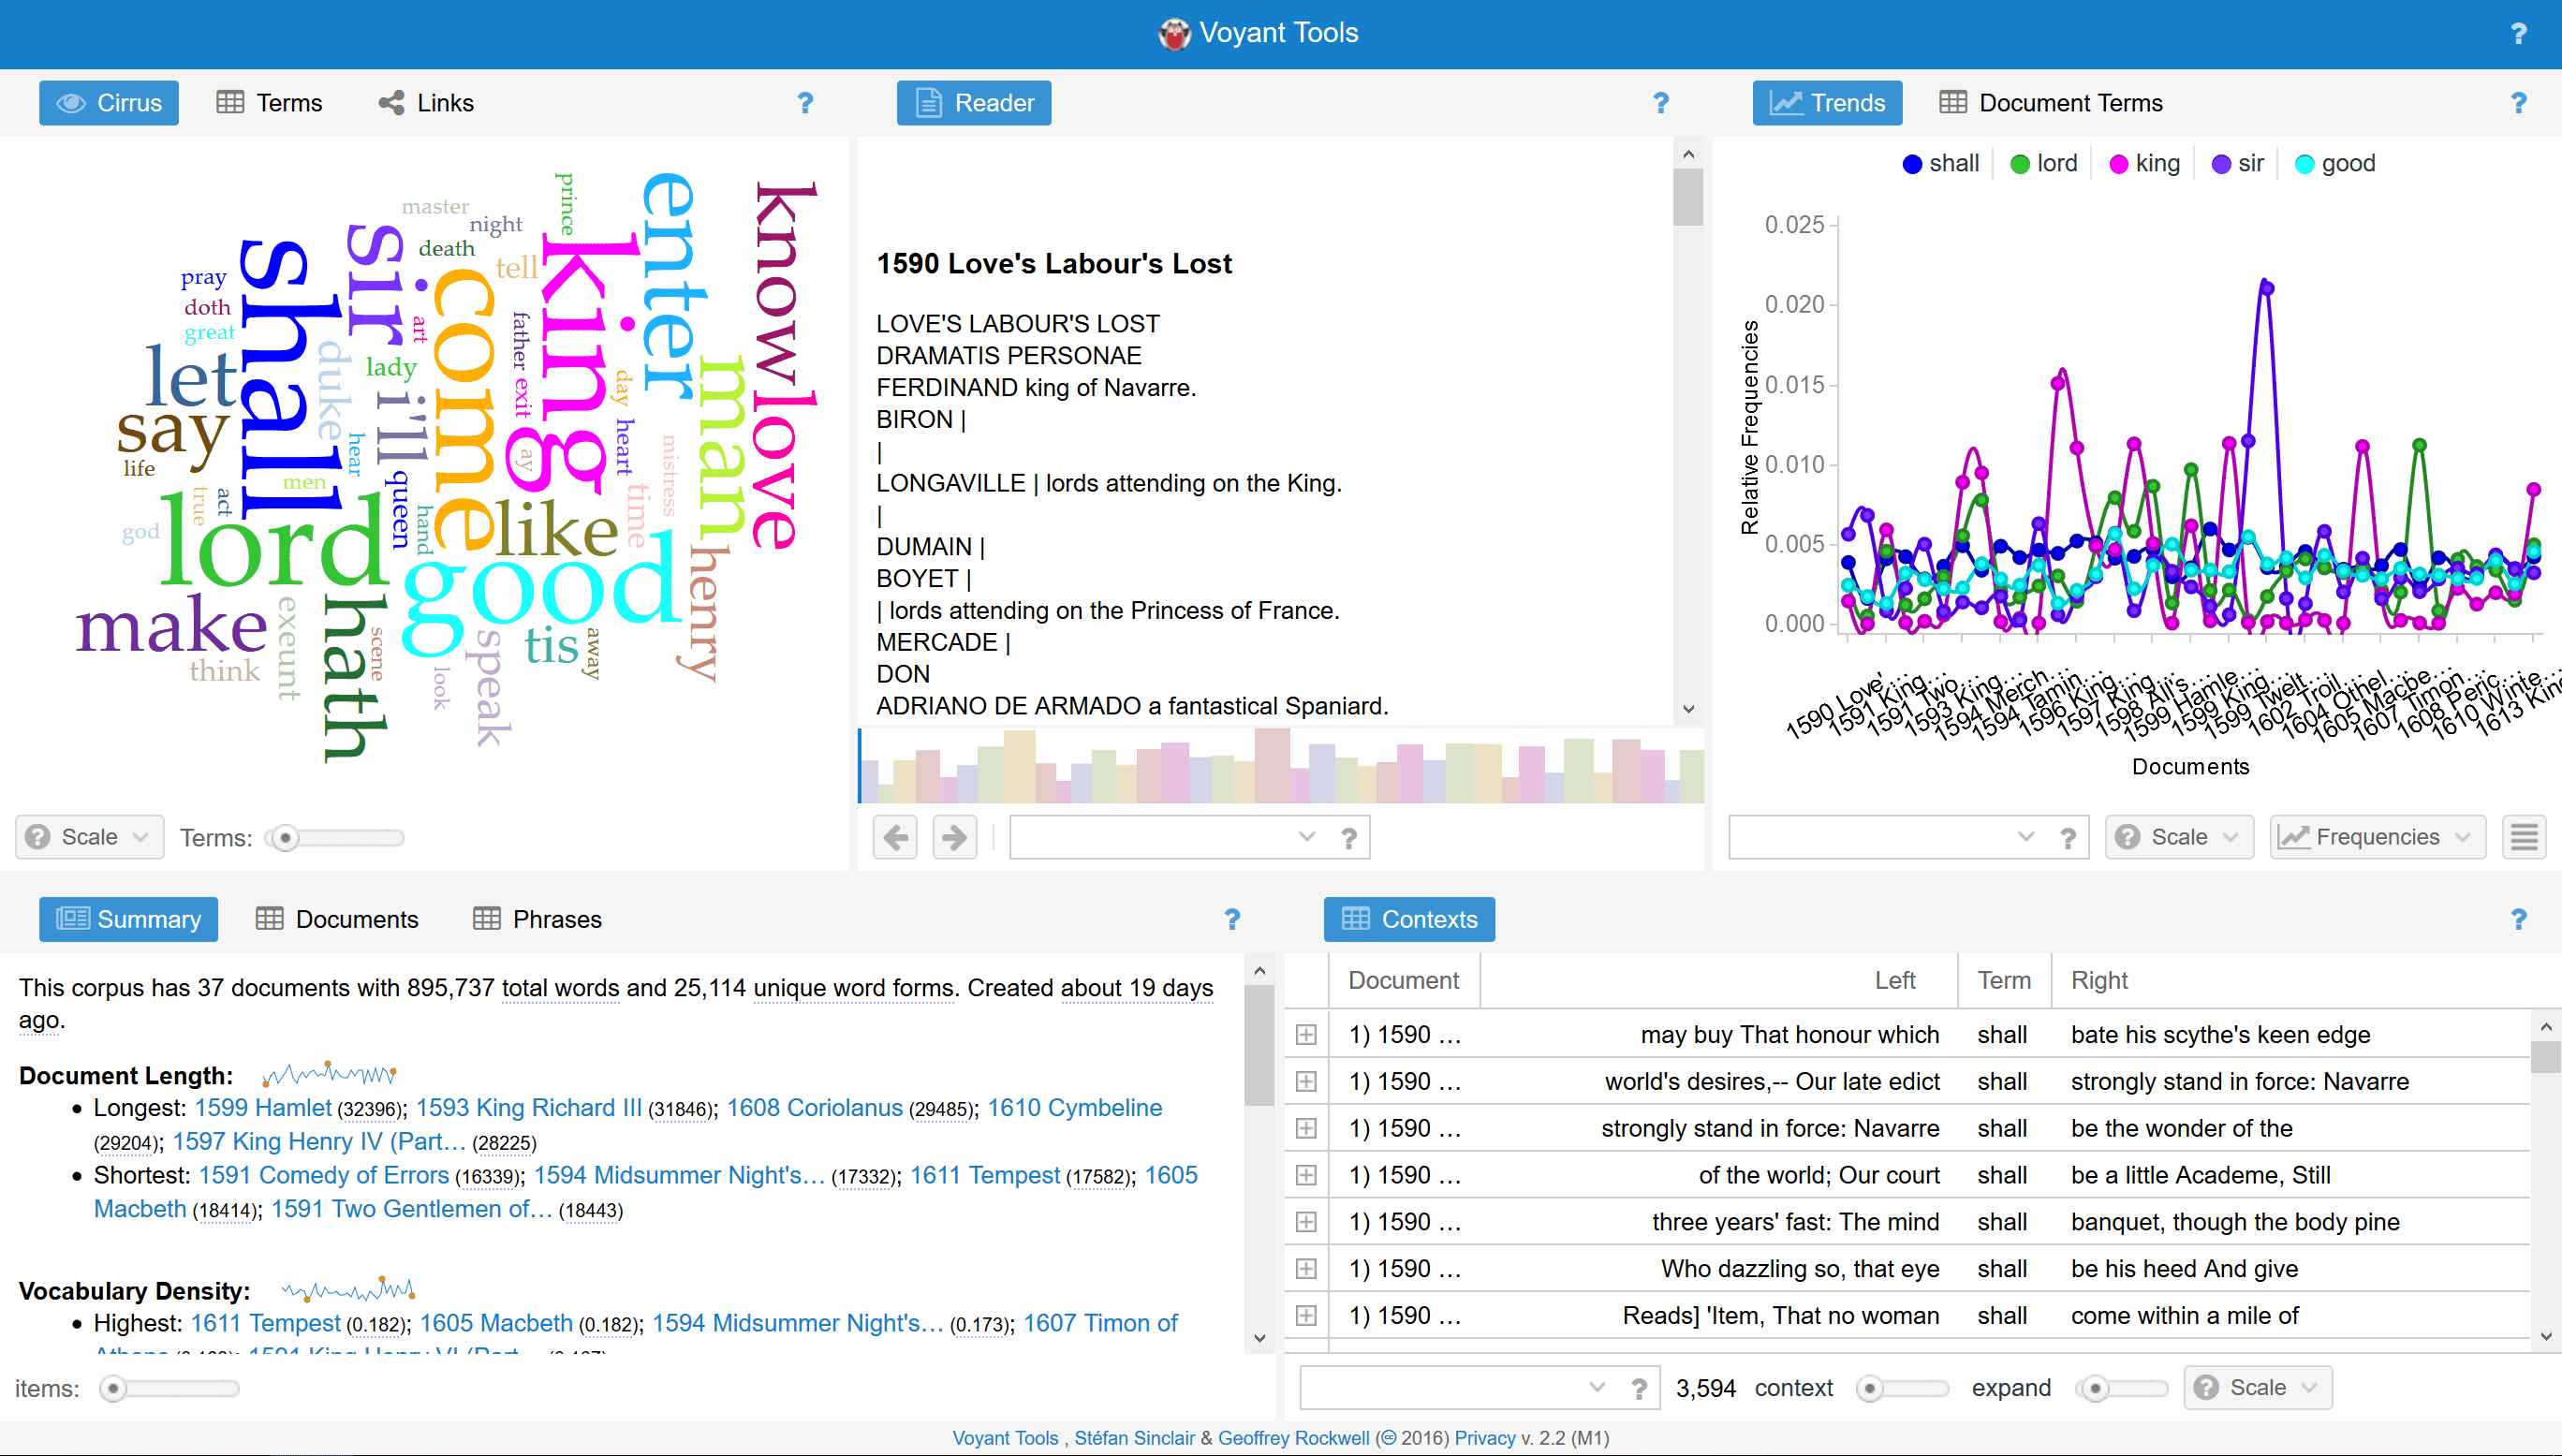
Voyant Tools
A web-based reading and analysis environment for digital texts.
Voyant Tools
Code
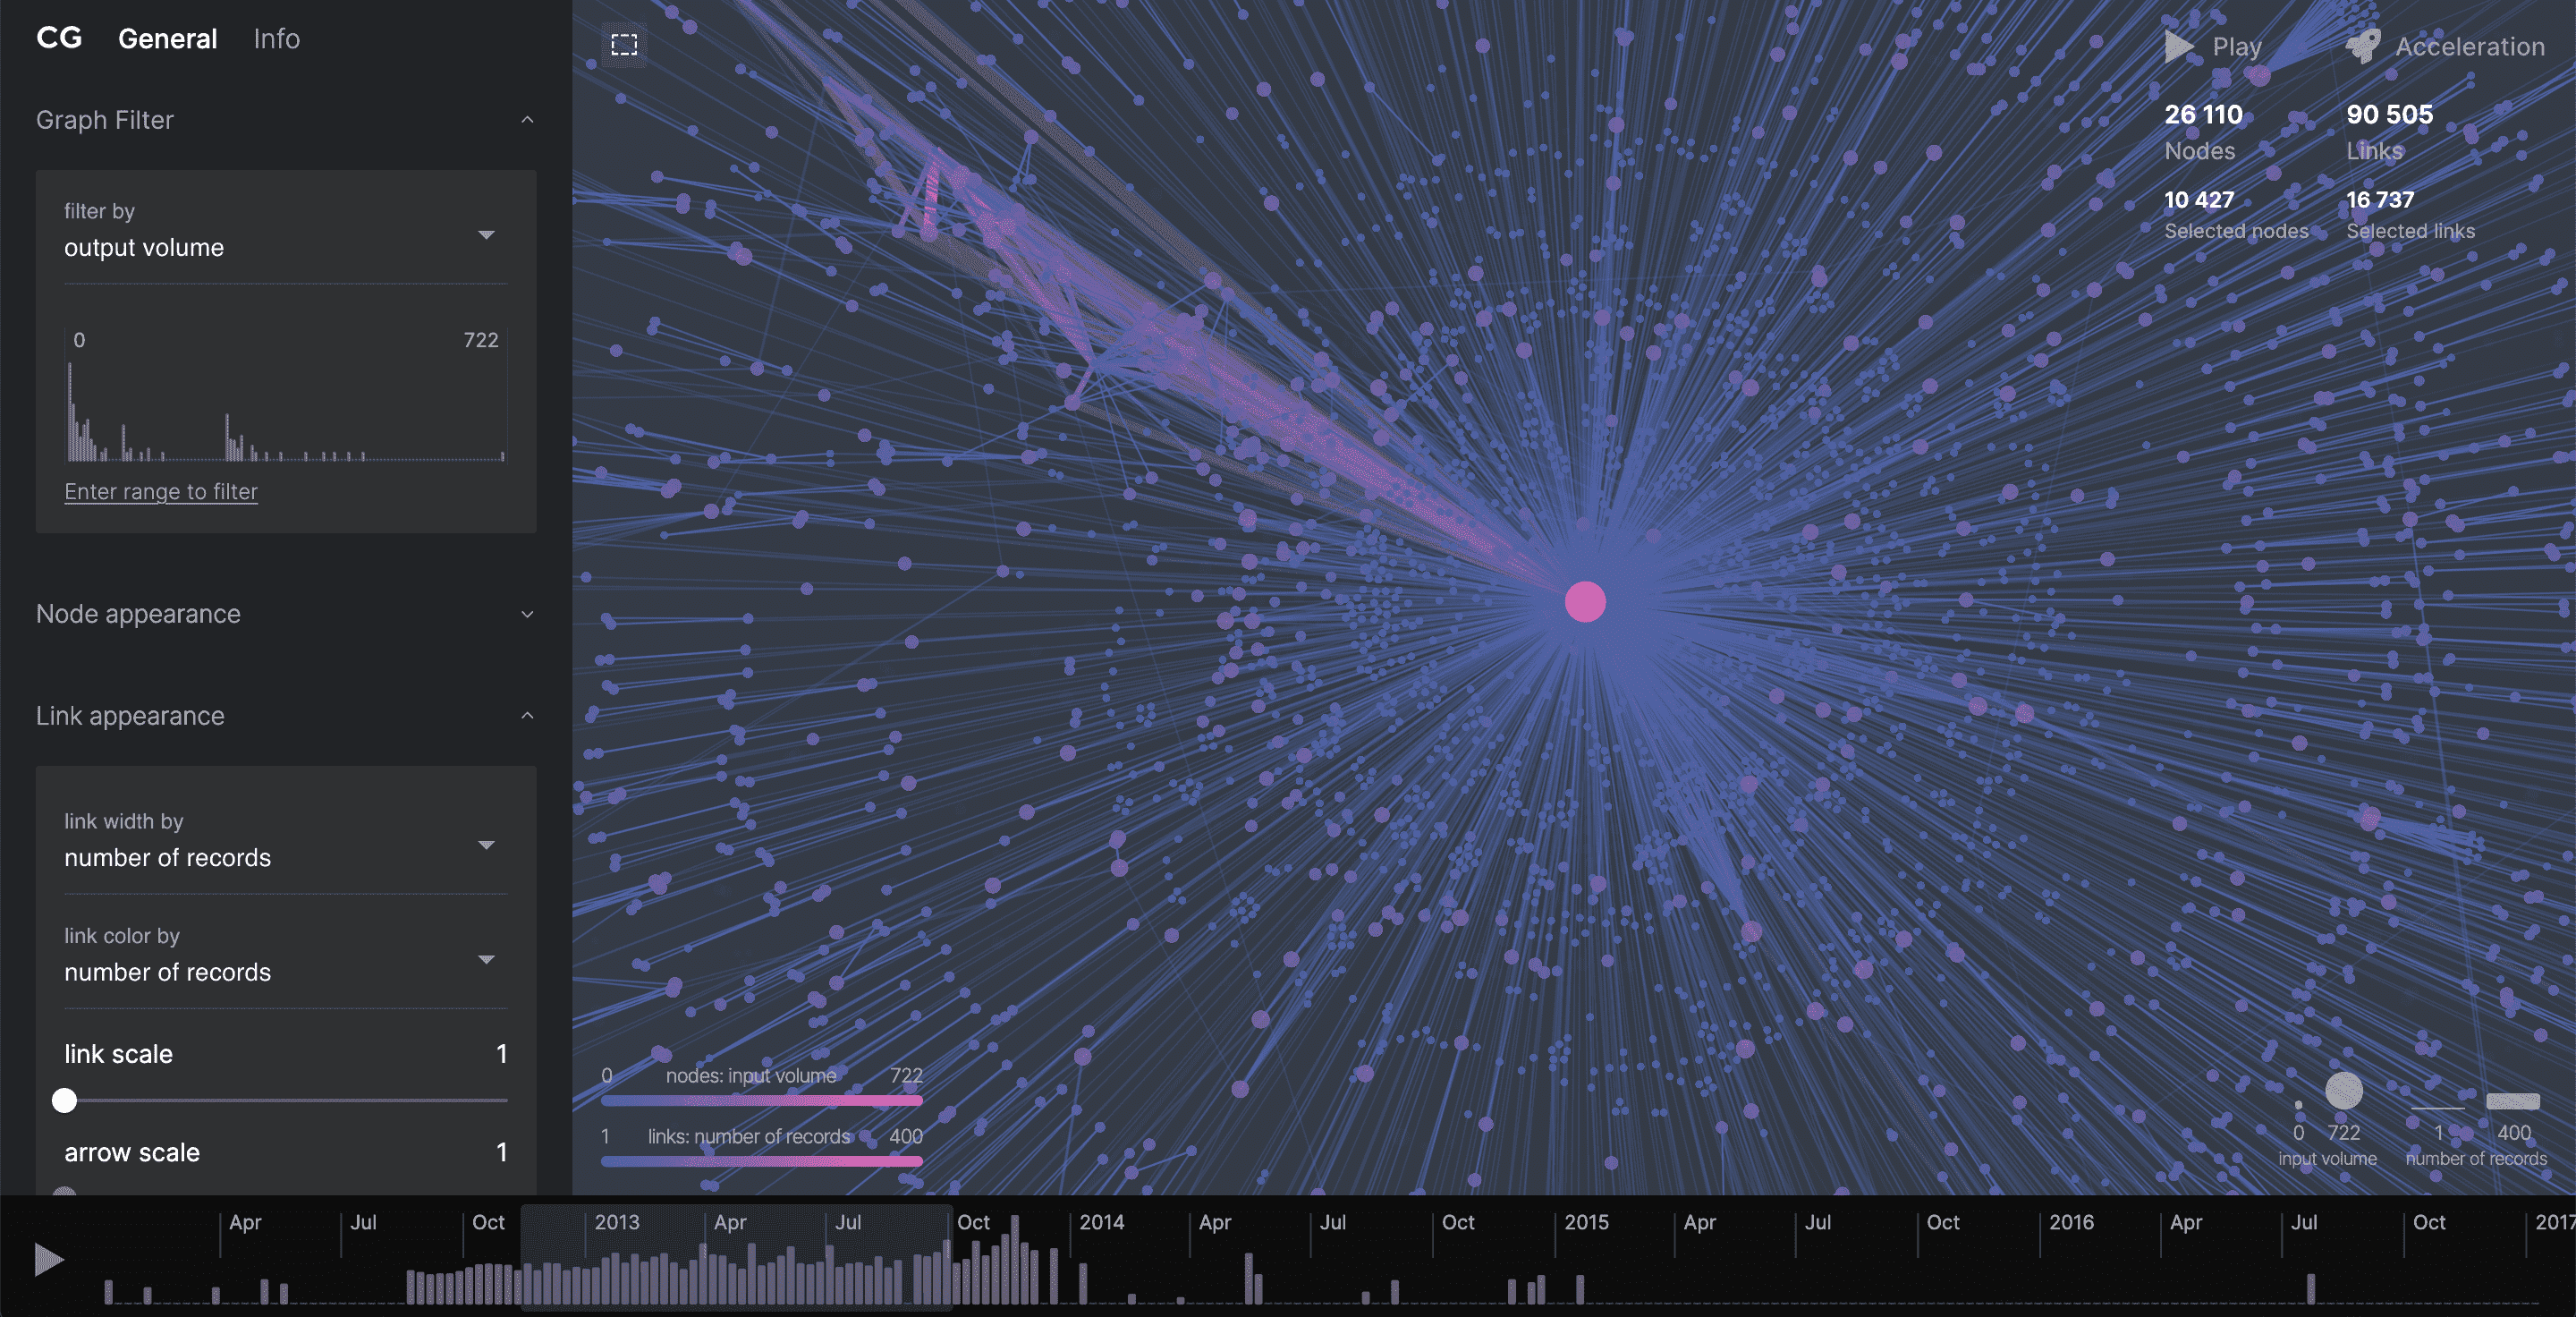
Cosmograph
With a reasonable trade-off in force graph simulation accuracy, Cosmograph creat...
Cosmograph
No-code
RAW Graphs
A free and open source tool for data visualization.
RAW Graphs
No-code
Datawrapper: Create charts, maps, and ta...
Create interactive, responsive & beautiful data visualizations with the online t...
Datawrapper
The Pudding
The Pudding explains ideas debated in culture with visual essays.
Pudding.cool

Learning
Society for News Design
World's Leading Visual Storytelling and Journalism Community
Society For News Design